
Or like that.

Later on there was all kind of action at Hookipa. Surfing, windsurfing and SUP training for today's contest (photo by Jimmie Hepp from this gallery).

The waves won't be as big as the previous one (photo APP), but it will be fun to watch for sure. They're gonna be sprinting in and out of the waves, rounding buoys. The start is scheduled for 11am and there should be a live webcast on the APP website. Tomorrow they will have a long distance race on the Maliko run, but not much wind is forecasted to push them.

As far as the Legends of the Bay contest goes, all I could find out is that the open men final was epic and the four finalist were Randy Welch, Dege O'Connell, Granger Larsen, Tanner Hendrikson. Not surprised to see Dege and Granger in there, as I said they were the ones that impressed me the most. Didn't see the other two surfing, but Tanner must have been very in tune with the waves to win.

The Legends heat was won by Mark Anderson. Photos by Erik Aeder.

4am significant buoy readings
South shore
1.7ft @ 9s from 222° (SW)
1.3ft @ 16s from 205° (SSW)
1.3ft @ 12s from 243° (WSW)
1.2ft @ 11s from 259° (WSW)
Gonna be a fun family day on the south shore... Yesterday Lahaina side was waist to occasionally chest high in the morning. Check the webcams.North shore
NW001
3.5ft @ 10s from 313° (NW)
Pauwela
4.6ft @ 10s from 343° (NNW) I was expecting to find less swell at Pauwela this morning (it was really small yesterday at sunset), so I checked the graph and found out that at 4am the colored swell line (whatever color Surfline decides to assign to the main swell) coincided with the black line (significant wave height).
That is a rare occurrence that gives me the opportunity to briefly elaborate about it.
First, here's the definition: The significant wave height WVHT is calculated as the average of the highest one-third of all of the wave heights during the 20-minute sampling period
On the right of the picture below, there's the NOAA website where you can read the buoy measurements value in their "old school" table. I circled the four colums I used to check, before I found out about the Surfline buoy page.
As long as there's only one swell in the water, reading the table or looking at the graph will give you the same information. I still like the graph much better, because it's easier to spot the peak of a swell and see the trend. But as long as there's more than one swell, the table becomes counterproductive and deceiving, because it will show the dominant swell only.
More precisely, the WVHT will be the one measured by the buoy and ALL the swells in the water will eventually contribute to it (that's why I often refer to the black line on the Surfline graph as "the sum of the energies of all the swells"). But the next three columns (I put red arrows on them), will report the values of the swell height, period and direction ONLY of the dominant swell.
Instead, the Surfline graph will show (with different colors) ALL the swells in the water. And I don't even need to mention why it is so important to know that. What's funny is that Surfline gets all the data from the NOAA. So the difference is in the graphic tool chosen to represent it and its effectiveness. As far as I'm concern, graph beats table 10-0.

And while I was writing all that (didn't I say briefly?), the 5am reading became available (thank you Pauwie) and here's how it looks on Surfline:
3.4ft @ 9s from 19° (NNE)
2.6ft @ 11s from 353° (N)
1.1ft @ 5s from 81° (E)
That's more like it. And even if in this case knowing more precisely what's in the water won't make me choose a spot over another (not much to choose from, really), it still feels good to know that there's two different swells with slightly different periods and directions.
That's more like it. And even if in this case knowing more precisely what's in the water won't make me choose a spot over another (not much to choose from, really), it still feels good to know that there's two different swells with slightly different periods and directions.
Wind
In the endless (screwed up) situations that the MC2km maps propose us, here's a new one that I haven't seen yet. The map below is for today 1pm. It's freshly updated (check the upper right corner time stamp). It shows light onshores.

The next map is 2pm, but not only it's not updated (time stamp says Friday), but it's also not today's map at 2pm, it's yesterday's map at 2pm! I know that for sure, since I checked them yesterday and I remember perfectly the shape of that little light grey are over Hookipa (which will become bigger at 4pm). So, this website wins the Oscar for more reliable wind prediction and less reliable updates.

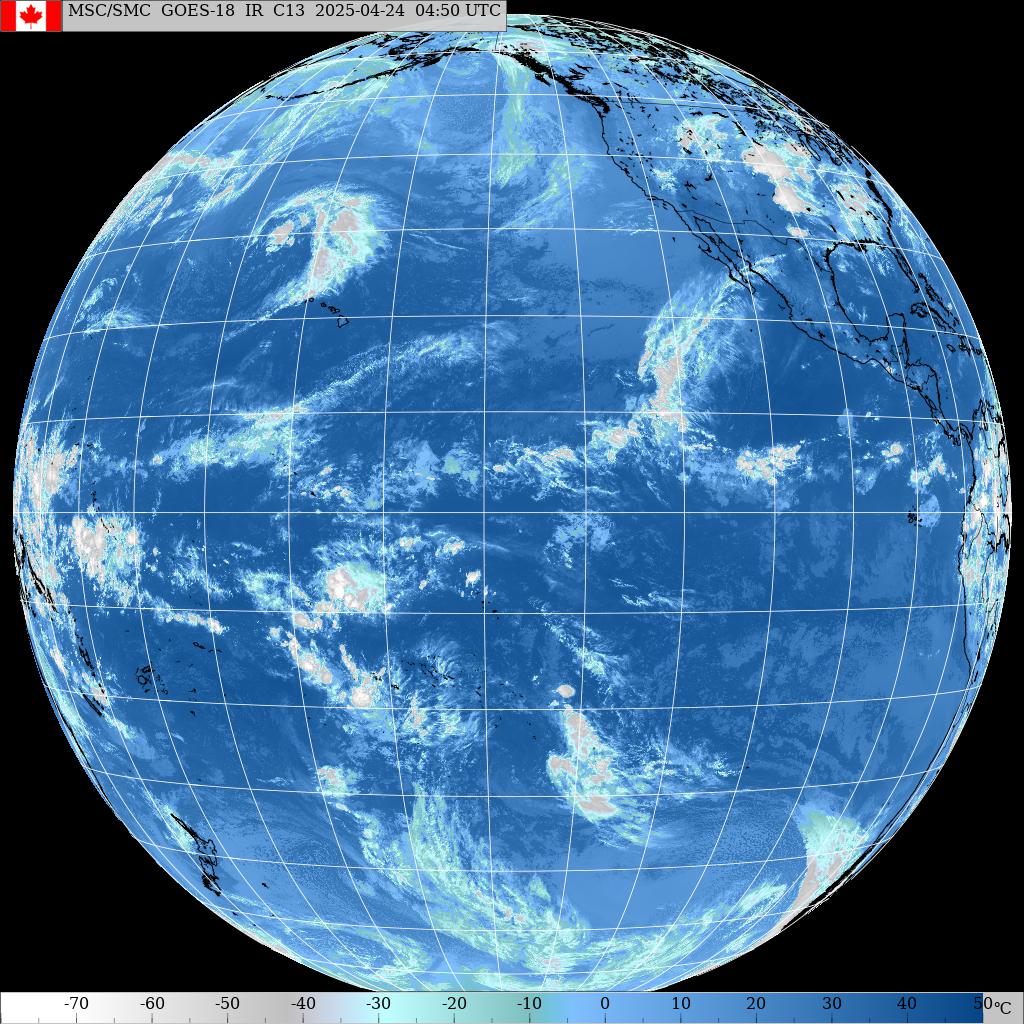
Current wind map shows:
1) distant WNW fetch
2) pretty close NW fetch. So close that the related swell might pick up already tomorrow afternoon with some 10s energy first and then peak Monday at 7f 12s according to Surfline. Very similar behavior to the previous swell, but not as big.

Looks like we have another gorgeous day ahead of us.


No comments:
Post a Comment