I grabbed this photo from Kai Lenny's instagram page. He was in Fiji for whatever SUP contest and of course he didn't miss the opportunity of getting seriously shacked at Cloudbreak. Here's what he wrote: "This was my third trip to Fiji this year and I still don't feel like it was enough. You can never have to much barrel therapy! I do feel like I have come a long way surfing Cloudbreak. When I was a little kid it started off with a few tower tours and Fijian tattoos. Now my barrel to reef rash ratio has improved to the point I'm leaving this beautiful place with all my skin!"
I left this comment:"You're leaving? 10ft 15s on Wednesday brah!", but I'm sure he knows that already.

In the afternoon, I briefly stopped by Hookipa and took a few hand held shots sitting on the guardrail.
Below is Federico Morisio on a wave that was well over mast high and that I'm gonna use to explain something.
Let's try to guess the size of the highest point of the wave. The mast is 4 meters. Where to lip is breaking (a little downwind of him), for me it's around 6 meters, which is 20 feet. Maybe a little generous, but stick with me.
As we will see in the forecast vs buoy graphs comparison below, in the water there were two mains swells:
- 4f 18s from 325, which I'm gonna call ground swell
- 9f 9s from around 75 (which is parallel to the Kahului to Hookipa coast line), which I'm gonna call windswell
That wave he's on is clearly a long stretched wall of the ground swell. 4f 18s from an unblocked direction can easily produce mast high waves at Hookipa. But that extra half mast on the peak is just as clearly due to the windswell that is travelling across (right to left) and adds it's own energy and size. That peak would actually not be there at all, if there wasn't a windswell in the water at the same time.
That's the wave that made me decide not to sail there, btw. Mast and a half peaks, plenty chop and occasional channel closing sets, means too high chance to go on the rocks with my skills.

Gorgeous bottom turn by Levi Siver.

Really proud of this shot of this successful sick aerial by Antoine Martin. I was just standing when this happened.

5am significant buoy readings
South shore
Lanai
2ft @ 15s from 296° (WNW)
0.9ft @ 9s from 179° (S)
0.5ft @ 3s from 14° (NNE)
0.4ft @ 4s from 170° (S)
Barbers
1.5ft @ 18s from 198° (SSW)
The southerly energy disappeared at the Lanai buoy, probably overwhelmed by the wrap of the NW swell, but it's clearly still there. The new pulse coming from the day when the fetch moved east of New Zealand is actually reading a beautiful foot and a half with 18s period at Barbers. Worth a look at the Lahaina webcam, for sure.
North shore
NW
9.1ft @ 9s from 86° (E)
4.2ft @ 13s from 303° (WNW)
Pauwela
8.8ft @ 9s from 73° (ENE)
4.2ft @ 15s from 326° (NW)
3.9ft @ 8s from 76° (ENE)
In the photo below, I put side by side yesterday's Surfline forecast for Maui's north shore and the Surfline graph of the Pauwela buoy as it looks this morning.
From a qualitative point of view, they are extremely similar. The two main swells I talked about above describing Federico's wave are perfectly represented on both graphs:
- a steady elevated windswell (red color in the forecast on the left, dark blue in the buoy graph on the right)
From a qualitative point of view, they are extremely similar. The two main swells I talked about above describing Federico's wave are perfectly represented on both graphs:
- a steady elevated windswell (red color in the forecast on the left, dark blue in the buoy graph on the right)
- a ground swell that peaked during the night (yellow on the left, light blue on the right)
The difference is eventually in the height that both swells reached, but in the end that is not as important as knowing what swells are in the water. That's why I prefer Surfline's offshore swells tab: it tells you exactly how the buoy is going to look. How big are the waves going to be at the spot(s) of your interest, it's up to you to know by building your local knowledge based on the empirical observations once the swells hit.
Here's how to get to that graph: click link. n.15 on my blog, then click on the "offshore swells" tab. If the graph doesn't show on your Internet Explorer (it doesn't on mine), try with Firefox or Chrome.
ANY attempt to predict the wave faces made by the common wave forecast websites is destined to fail. Why? Because they are automatically generated by software programs using algorithms that have no or little local knowledge into them.
Take the same Surfline, for example. Here's the tab called "Regional Forecast Dashboard" and it shows... I don't even know what that is, really. To me that looks like the windswell open ocean size and there's no info about the ground swell at all. But if you just click the offshore swells tab, RIGHT NEXT TO IT, then you have the graph above and all the info you need. Nothing less. Everything, even tide, wind and clouds (even though I like to check that on other websites where it's easier to read them).
Take the same Surfline, for example. Here's the tab called "Regional Forecast Dashboard" and it shows... I don't even know what that is, really. To me that looks like the windswell open ocean size and there's no info about the ground swell at all. But if you just click the offshore swells tab, RIGHT NEXT TO IT, then you have the graph above and all the info you need. Nothing less. Everything, even tide, wind and clouds (even though I like to check that on other websites where it's easier to read them).
One more example, otherwise you guys won't believe me. This is the Magiseaweed forecast for Hookipa for today. I like that they have two colums for the primary and secondary swell (I don't like that it's a table instead of a graph though). I like that they call the ground swell primary and the windswell secondary (like it should be).
But what the hell is the Surf column saying? Is it going to be 3-4f at noon? Faces? I should send them that photo from yesterday and tell them "hey, you guys were only 15 feet off..."
Anyway, stick to the offshore swells predictions and make your own guess of the actual size is my recommendation.
As far as I know, only Pat Caldwell tries to put his local knowledge in his table. Everybody else just grabs the publicly available WW3 model output (which uncle Pat checks too, of course) and put it in different graphic forms.
Surfline is my favorite graphic form and, (I'm finally going to conclude this long dissertation), from that graph you now know that the ground swell will be declining all day, while the windswell will stay steady.
If they didn't run Honolua and Sunset yesterday, I doubt they will do it today. The possibility of the ladies moving the whole production to Pavillions is real. And that is exciting for me, 'cause in that case I'm gonna be taking photos from the rocks. Work permitting, of course.

-- 9am update after having watched the morning show: they're also going to monitor that big NW swell forecasted for the last two days of the waiting period: Friday Dec 2nd and Saturday 3rd. The swell is predicted to be 10.7f 15s from 317 on Surfline at 8am on Saturday (no need to specify which tab I'm looking at at this point) and even though that is blocked direction for the Bay, it's big enough for the more northerly sets to wrap in there. The problem is that is based on a fetch that hasn't formed yet. It's in the output of the wind models (the GFS being the most commonly used) and that can change. We'll see. --
Current wind maps shows:
- a weak and distant NW fetch (the much stronger one to the NE of it is so west to east that I didn't feel like circling)
- the windswell fetch
- another day of strong Tasman Sea fetch. Too bad Kai is leaving Fiji...

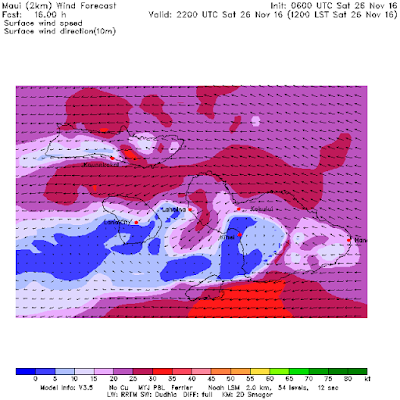
Today it's a little later than usual, so my favorite wind prediction website has its maps updated and here is the MC2km map at noon showing the usual strong easterly trades. Maybe a tad more offshore than it has been?

Well, since I had prepared it already, this is also the NAM3km map at noon and it confirms the offshore nature of today's trades. Even gustier at Hookipa. I actually like the graphical representation of this one a bit better, but its resolution is not as precise as the one above. The wind in the Thousand Peaks area is a good example of that.

PS. I think this is one of the best posts I've done about how to read the wave forecasts, and I'm going to label it just that ("how to read the wave forecasts") to make it easily accessible through the "labels" section of this blog for future references.


2 comments:
An advance course in swell predictions. Thanks, very interesting !
Thanks for the comment, I'm glad you liked it.
Post a Comment