A shortboard session for me yesterday. This is my pick of Jimmie Hepp's gallery of the Hookipa windsurfing action.

3am significant buoy readings
South shore
Lanai
1ft @ 14s from 187° (S)
Background southerly energy registered by Lanai, that should keep the complete flatness away.
North shore
Waimea
4.4ft @ 13s from 332° (NNW)
3.8ft @ 7s from 35° (NE)
2.5ft @ 9s from 37° (NE)
1.4ft @ 4s from 37° (NE)
Pauwela
9.8ft @ 12s from 75° (ENE)
5.3ft @ 7s from 66° (ENE)
Of all the buoys, Waimea is the only one which registers some of the moderate NNW swell that is in the water. The reason is that Waimea is the most protected by the current strong easterly windswell, so its readings are not as much influence by it. That obviously means that the NNW is in the water in ALL of the Hawaiian islands, it's just that the other buoys don't have the ability to register it, as they are heavily battered by incessant easterly energy.
Below we have the energy spectrum plot of both the reported buoys. As you can see, the energy at the first one seems to be more from around 310 degrees, rather than the reported 332. Those plots are available at the link n. -1 of GP's list of meteo websites and are of great help, every time you want to verify the validity of the indication of the direction on the readings (which I grab from the Surfline page link n.11 instead).

Another way of trying to figure out the direction of a swell is to look at the history of the fetch. Below is the collage of the maps of April 9, 10 and 11. The red arrow indicates the fetch and the more you observe fetches and the resulting swells, the more you'll immediately know what spots will work or not for that swell. This whole analysis was sprouted from the "wrong" direction indication at Waimea of 332, which made me think that maybe this could have been a small under the radar day at Honolua. But nope, this is not the case.

So let's put our focus back again on the ENE windswell. I grabbed this image from the Buoys to Maui travel times and Maui's shadow lines post and it shows a geometrical shadow line for Hookipa of 68 degrees. The red line I drew indicated the direction shown by the buoy: 75. But the energy spectrum plot shows a red blob that covers more like 65 to 75, which of course helps with the size of the breakers at Hookipa.
Did you guys notice that the biggest moment of this windswell episode was Thursday afternoon? That's when Pauwela was recording something like 6-8ft 8s from 45, if I remember right. Yesterday it was more like 9ft 10s from 75 and it was smaller (because of the direction). Today is more like 10ft 12s from 75. The longer period should help it wrap around those land points and feel the bottom more so that it wraps along the coastline better. Will it be bigger than Thursday afternoon? We'll find out!

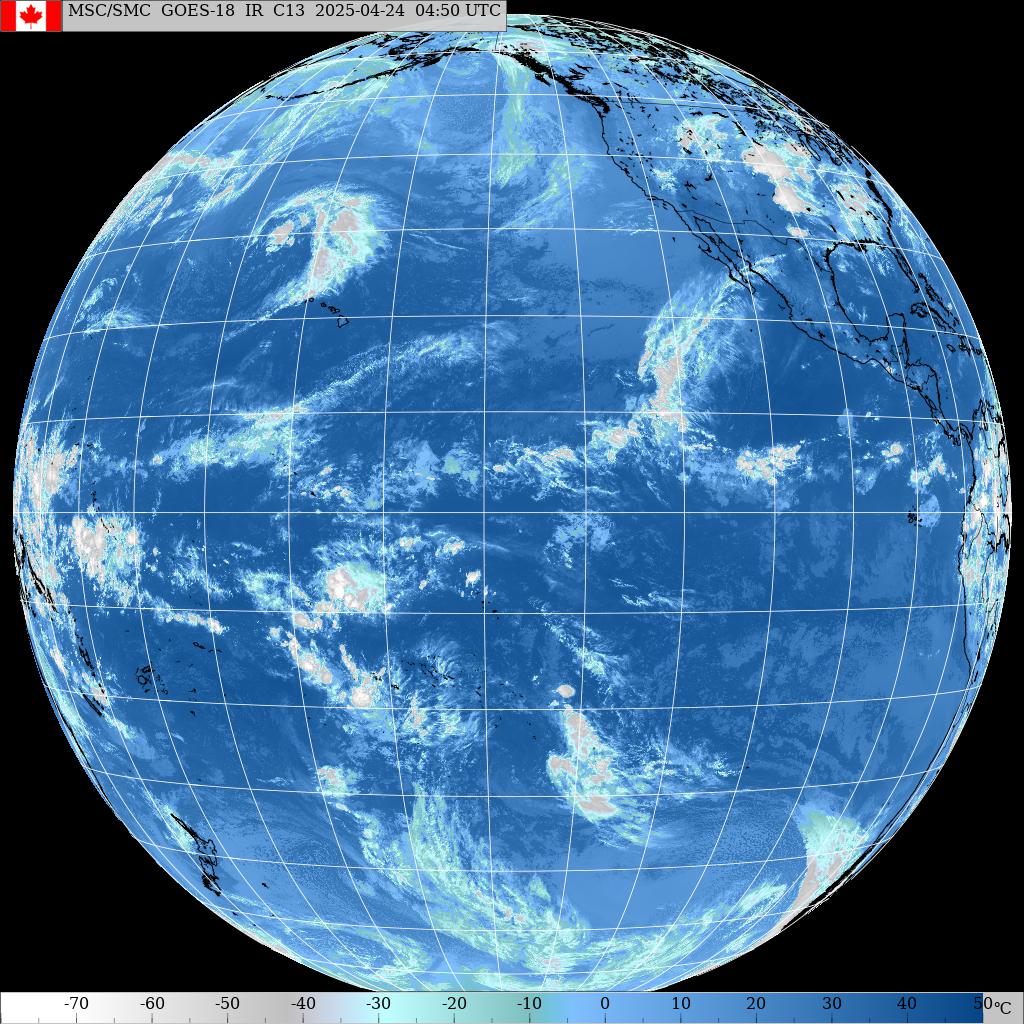
Wind map at noon.

North Pacific has a NW and the windswell fetch.

South Pacific offers small S and SSE fetches.

Morning sky.


No comments:
Post a Comment