
3am significant buoy readings
South shore
W
3.8ft @ 14s from 173° (S)
SW
3.8ft @ 14s from 181° (S)
SE
3.4ft @ 14s from 161° (SSE)
Barbers
3.8ft @ 15s from 193° (SSW)
Lanai
4.7ft @ 15s from 188° (S)
Yesterday afternoon the local buoys went up to 4f 17s and today the period is a bit shorter, but I like Lanai's 4.7f 15s seconds. That's a decent amount of energy, this might be the last big day of the season (which astronomically is already over), let's make the most of it.
Here's an email from a reader who proposes a possible explanation of why the periods are often different at the buoys. It's great to know that I have people like this reading my blog. Thanks a lot.
You commented today about why the SE and SW buoys have periods 2 secs apart. I think part of the reason is due to how Surfline processes the data. All the buoys provide raw data using frequency, not period, and the frequencies are pre-set at somewhat uneven intervals. The periods (just a few) at both the SE and SW buoys are: 17.24 s, 15.9 s, 14.7 s, 13.7s, 12.8 s.... and so on. Some of the near shore buoys use different frequencies which means lining up periods between an off-shore buoy and a near-shore one is a little tricky.
The raw data has a
power-density (energy) value and a direction value for each of those
periods. What I believe Surfline does is curve-fitting to interpolate
between periods and find the energy at the integral periods they report
on (13, 15, 17, etc.). So the curve fitting introduces error. It is
difficult because they have to curve fit both for period and for
direction. The data set they are curve fitting to is pretty sparse so
the result is going to be not very accurate. The other source of error
is the resolution of the instrument.
I looked
at the raw data from the SE buoy and the local maximum energy looks
closer to 16s to me, at least by eye. The raw data from SW buoy has
equal energy at 15.9 and 14.8 so it is probably between 15s and 16s.
Basically,
the Surfline data should have error bars of at least +/- 1s in period.
There are similar problems with the direction due to the interpolation
they are doing. It should also have error bars of +/- several degrees.
They do a good job but it is a difficult problem. I like looking at this stuff, I used to be a physicist.
North Pacific
NW101
4.3ft @ 10s from 350° (N)
Hanalei
4.1ft @ 10s from 328° (NW)
Wailea
3.2ft @ 10s from 325° (NW)
Pauwela
3.9ft @ 9s from 31° (NE)
3.1ft @ 6s from 79° (ENE)
2.8ft @ 11s from 336° (NNW)
NNW energy trending down at Pauwela, but with 4f 9s from 31 on top of that in the water, there will still be waves at Hookipa.
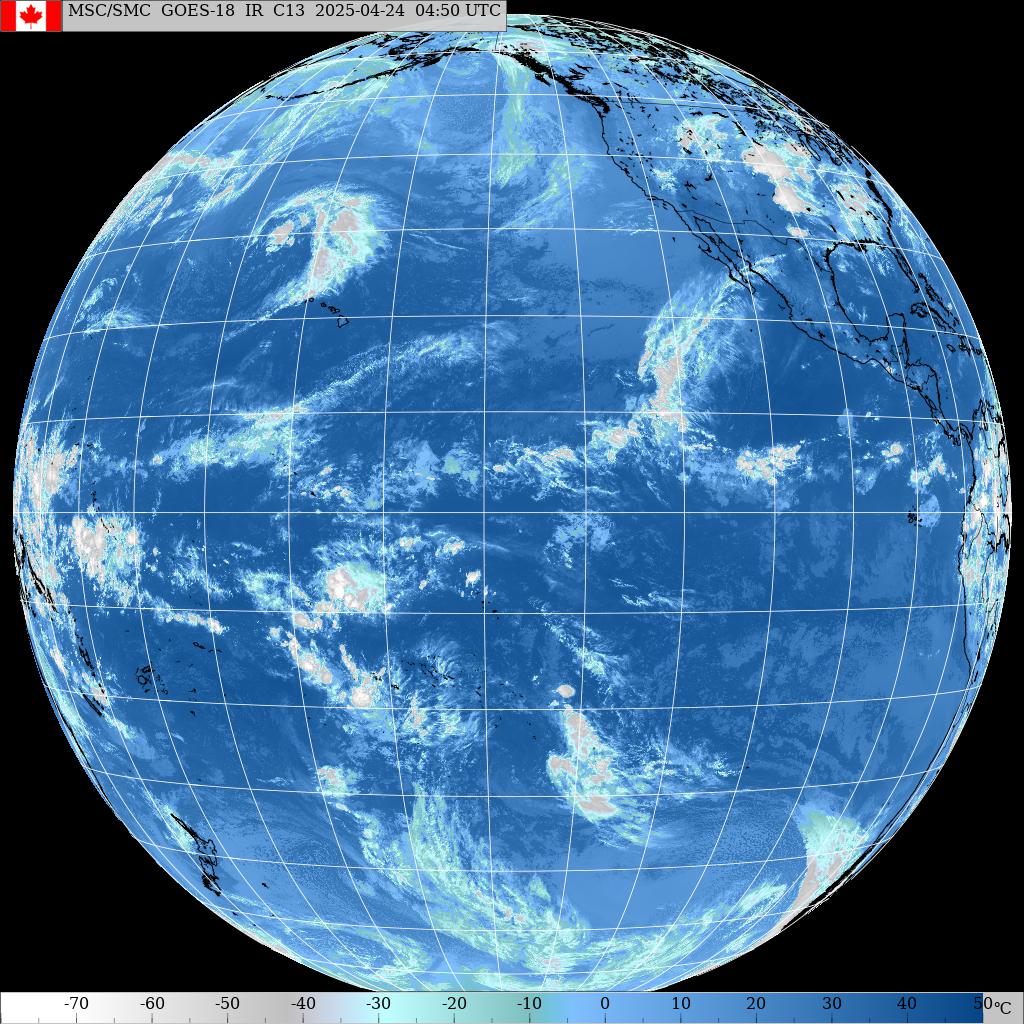
Wind map at noon.

North Pacific has a newly formed compact low that offers a tiny NW fetch, but there's still the long NNW one from the past couple of days. The Surfline forecast is now updated to 8f 12s on Sunday, surprisingly still small on Saturday morning and picking up only in the late afternoon. We'll see tomorrow what the buoys say.

Nothing of relevance again in the South Pacific.

Morning sky.


No comments:
Post a Comment